Anticipating trend reversals in Intel Corp (INTC:US)
The 0-4 line is one of the little-known tools in technical analysis. This lack of popularity benefits the validity of its signals compared to mainstream indicators like MAs and Fibonacci levels where whipsaws and stop hunting are common. Dr. Alan Andrews used the 0-4 line in his charting to anticipate market turns. Once breached, he expected that the ongoing trend is most likely over.
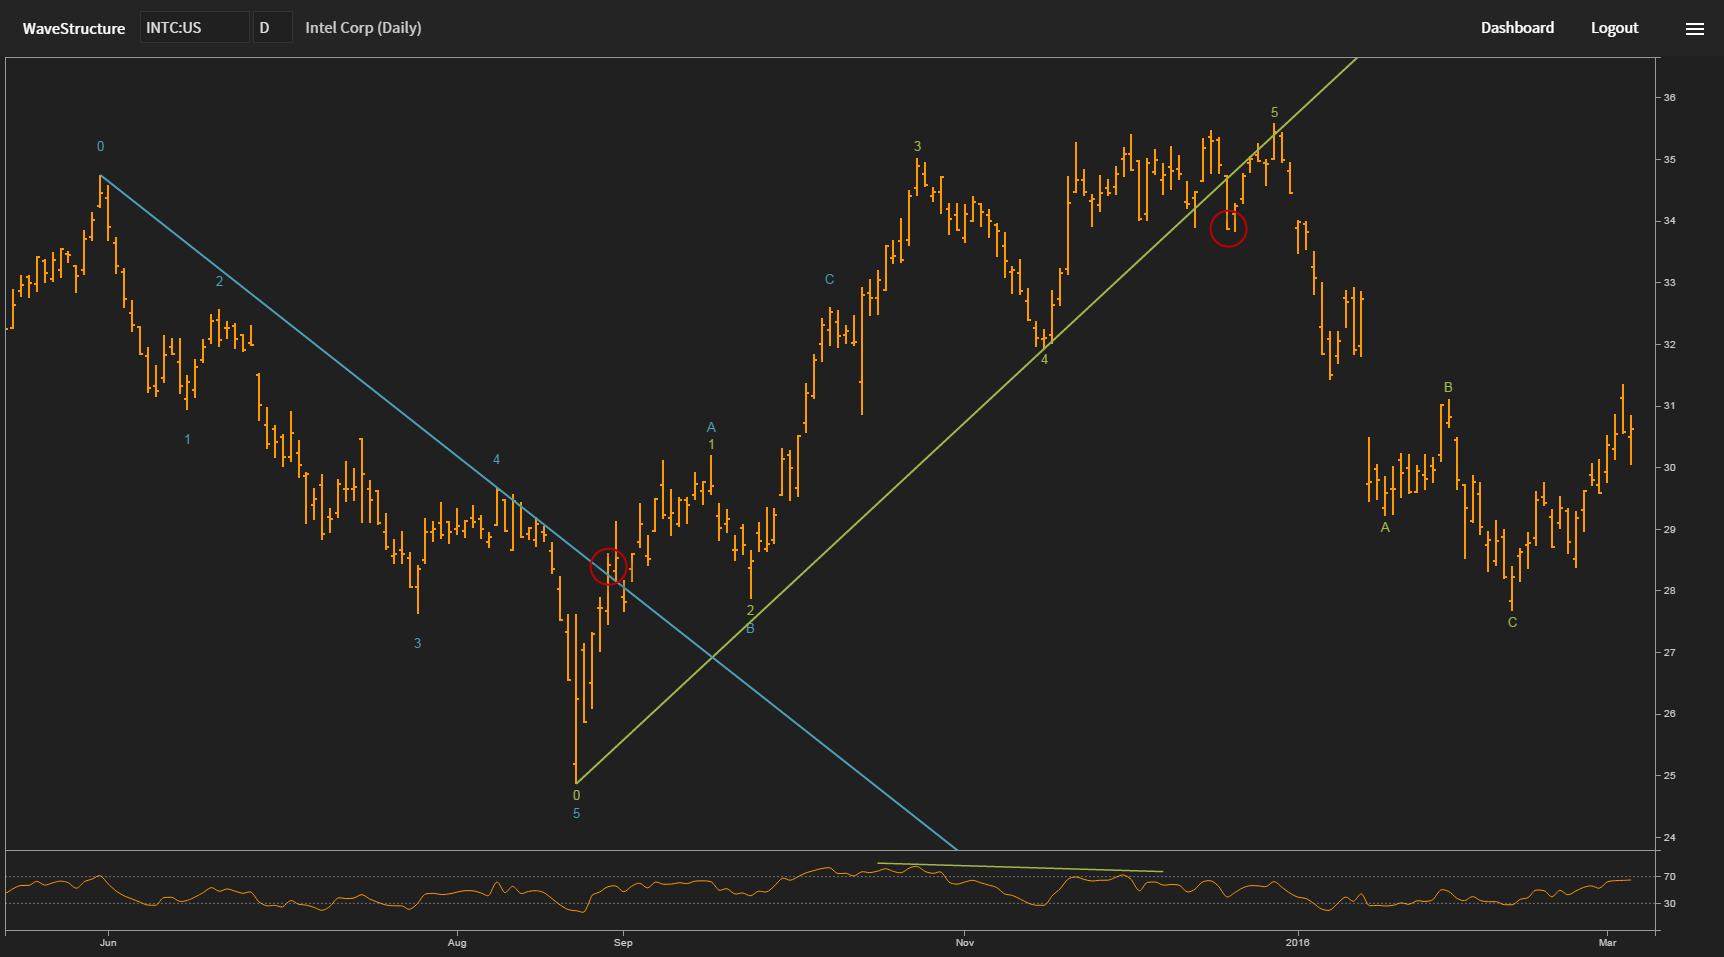
This chart of Intel Corp (INTC:US) shows two good 0-4 line examples. June 1 marked the beginning of a new downswing for Intel shares. Following a beautiful five wave decline the stock found its bottom on Monday, August 24 at $24.87. By the end of the week price advanced enough to close above the 0-4 line (marked on chart). This breach indicated that the downtrend is over and a new bullish advance is about to ensue.
In December five waves up could be counted on the chart. The advance seemed exhausted as confirmed by price/momentum divergence. On December 18, the up sloping 0-4 line was breached (marked on chart) signaling that the market is about to turn. Price tested the 0-4 line from below reaching 12 cents above the previous high before quickly reversing in a sharp 22 percent drop.