Significance of the Wave 1 break
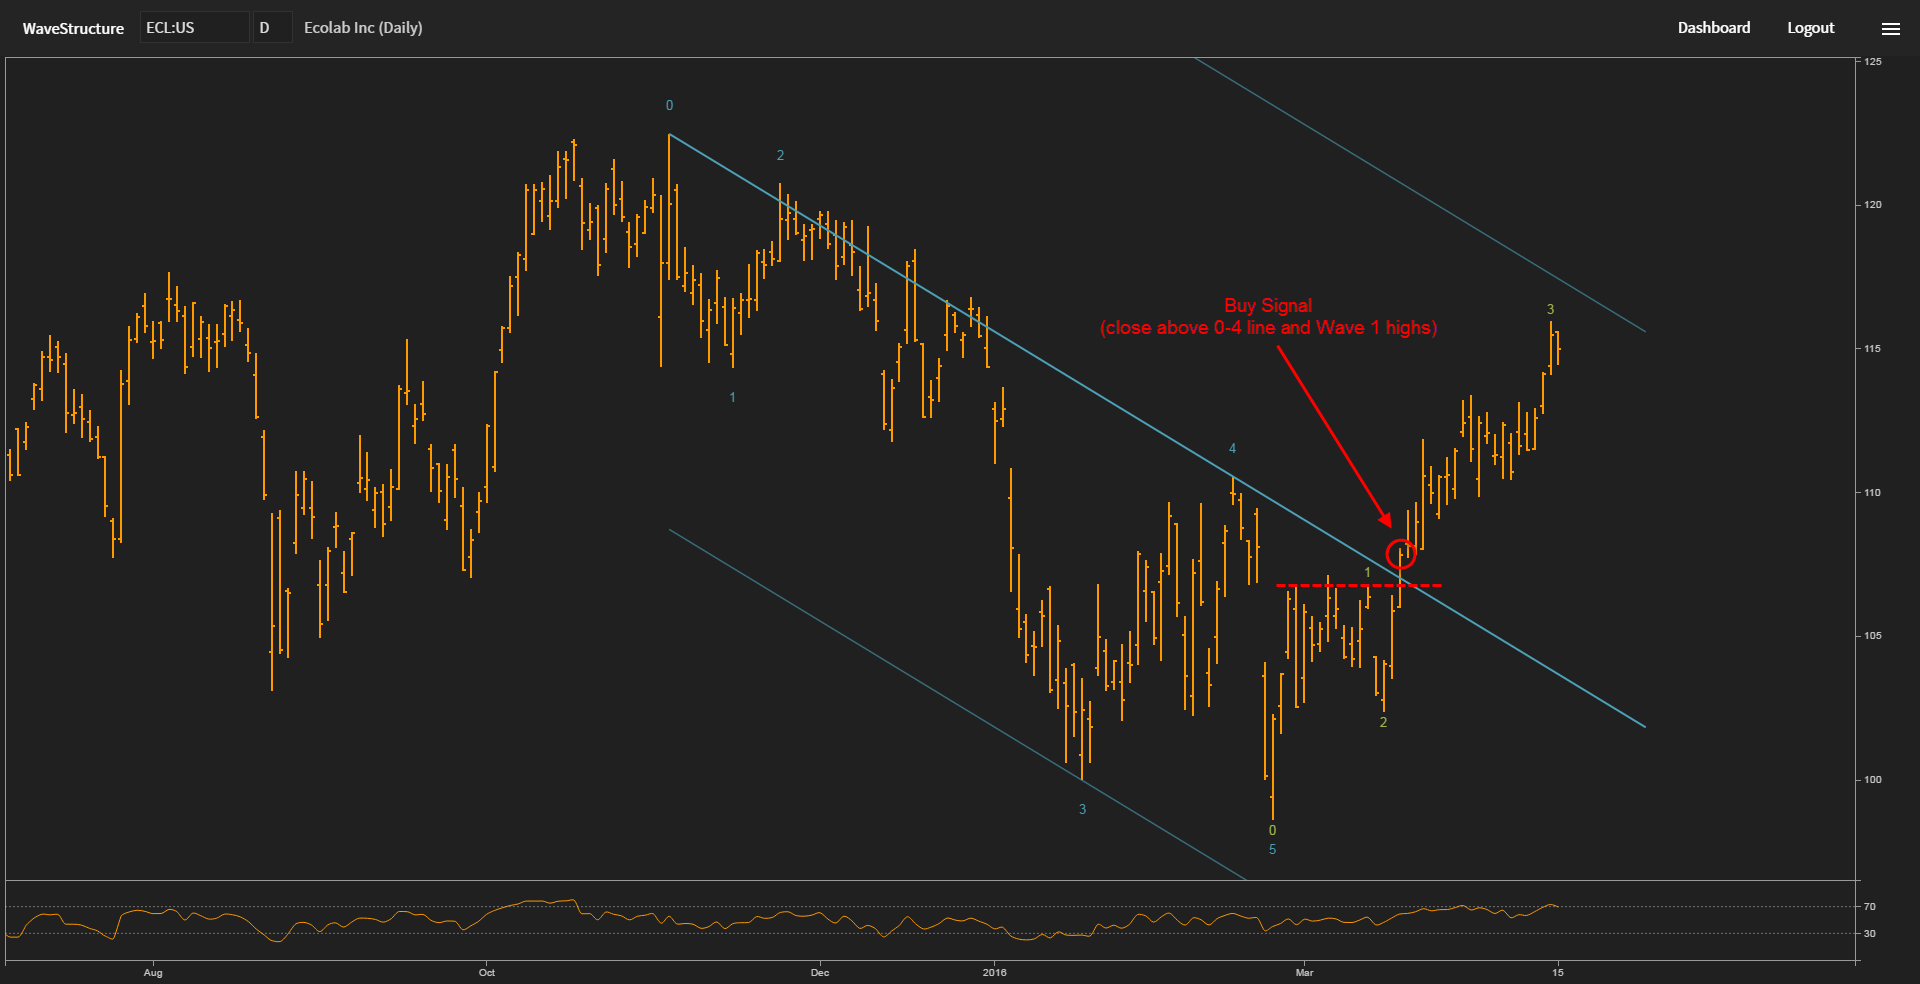
One of the signals we monitor at WaveStructure is the “Wave 1 break”. Within the Elliott Wave framework a close beyond Wave 1 extreme suggests that Wave 2 has ended and a new move in Wave 3 is underway. Often the longest and most impulsive, Wave 3 presents some of the best trading opportunities. However, it is important to understand that mere presence of a “Wave 1 break” signal is not a sufficient condition for initiating a trade. Just like the Divergence signal, we use the break of Wave 1 as confirmation. These are secondary cues to our main trade setup – a completion of a 5 wave sequence and a subsequent break of the Action-Reaction line set.
The chart of Ecolab (ECL:US) presents a case where the “0-4 line break” and the “Wave 1 break” signals occurred on the same day. On February 24, the 5 wave structure of the decline was deemed completed. By March 15 we identified waves 1 and 2 of a potential bullish move. A couple of days later price managed to break two key levels on a closing basis – the down sloping 0-4 line, and the highs of Wave 1. These events indicated that the move up is likely to extend. As shown on the chart price continued to rise in a third wave advance and is now approaching the Reaction line.